Curated Resource ( ? )
Visualising with Obsidian
Curated:
26/02/2023 from
www.sarman.work/visualising-with-obsidian-dataview
my notes ( ? )
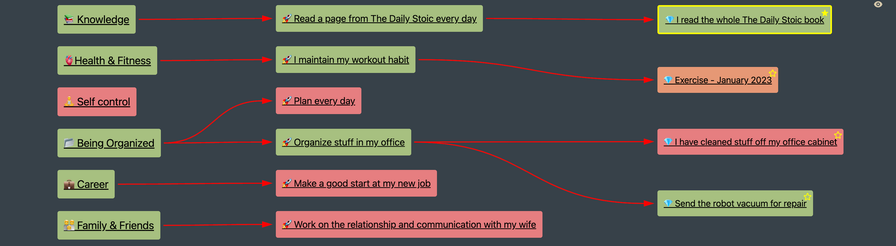
David's "journey trying to visualise relationships in my Obsidian notes" passed via various approaches, including d3, as he tried to create diagrams encapsulating relationships between nodes.
He then stumbled upon the obsidian-excalidraw-plugin ... [which] automatically generate Excalidraw diagrams with its Excalidraw Automate feature... with Dataview or Templater". Two drawbacks: diagram scaling, and customisability. Of these: difficult "to add Obsidian internal links to the graph, so I could click and open a given note", so he wrote his own with React.
This is a dealkiller for me, too: if you cannot click a node in a graph to explore a (related) note's content, it's not providing a graphical interface to knowledge.
Read the Full Post
The above notes were curated from the full post www.sarman.work/visualising-with-obsidian-dataview.Related reading
More Stuff I Like
More Stuff tagged visualisation , obsidian , excalidraw , knowledge visualisation , d3 , react
See also: Content Strategy , Communications Tactics